2015/10/31 22:43
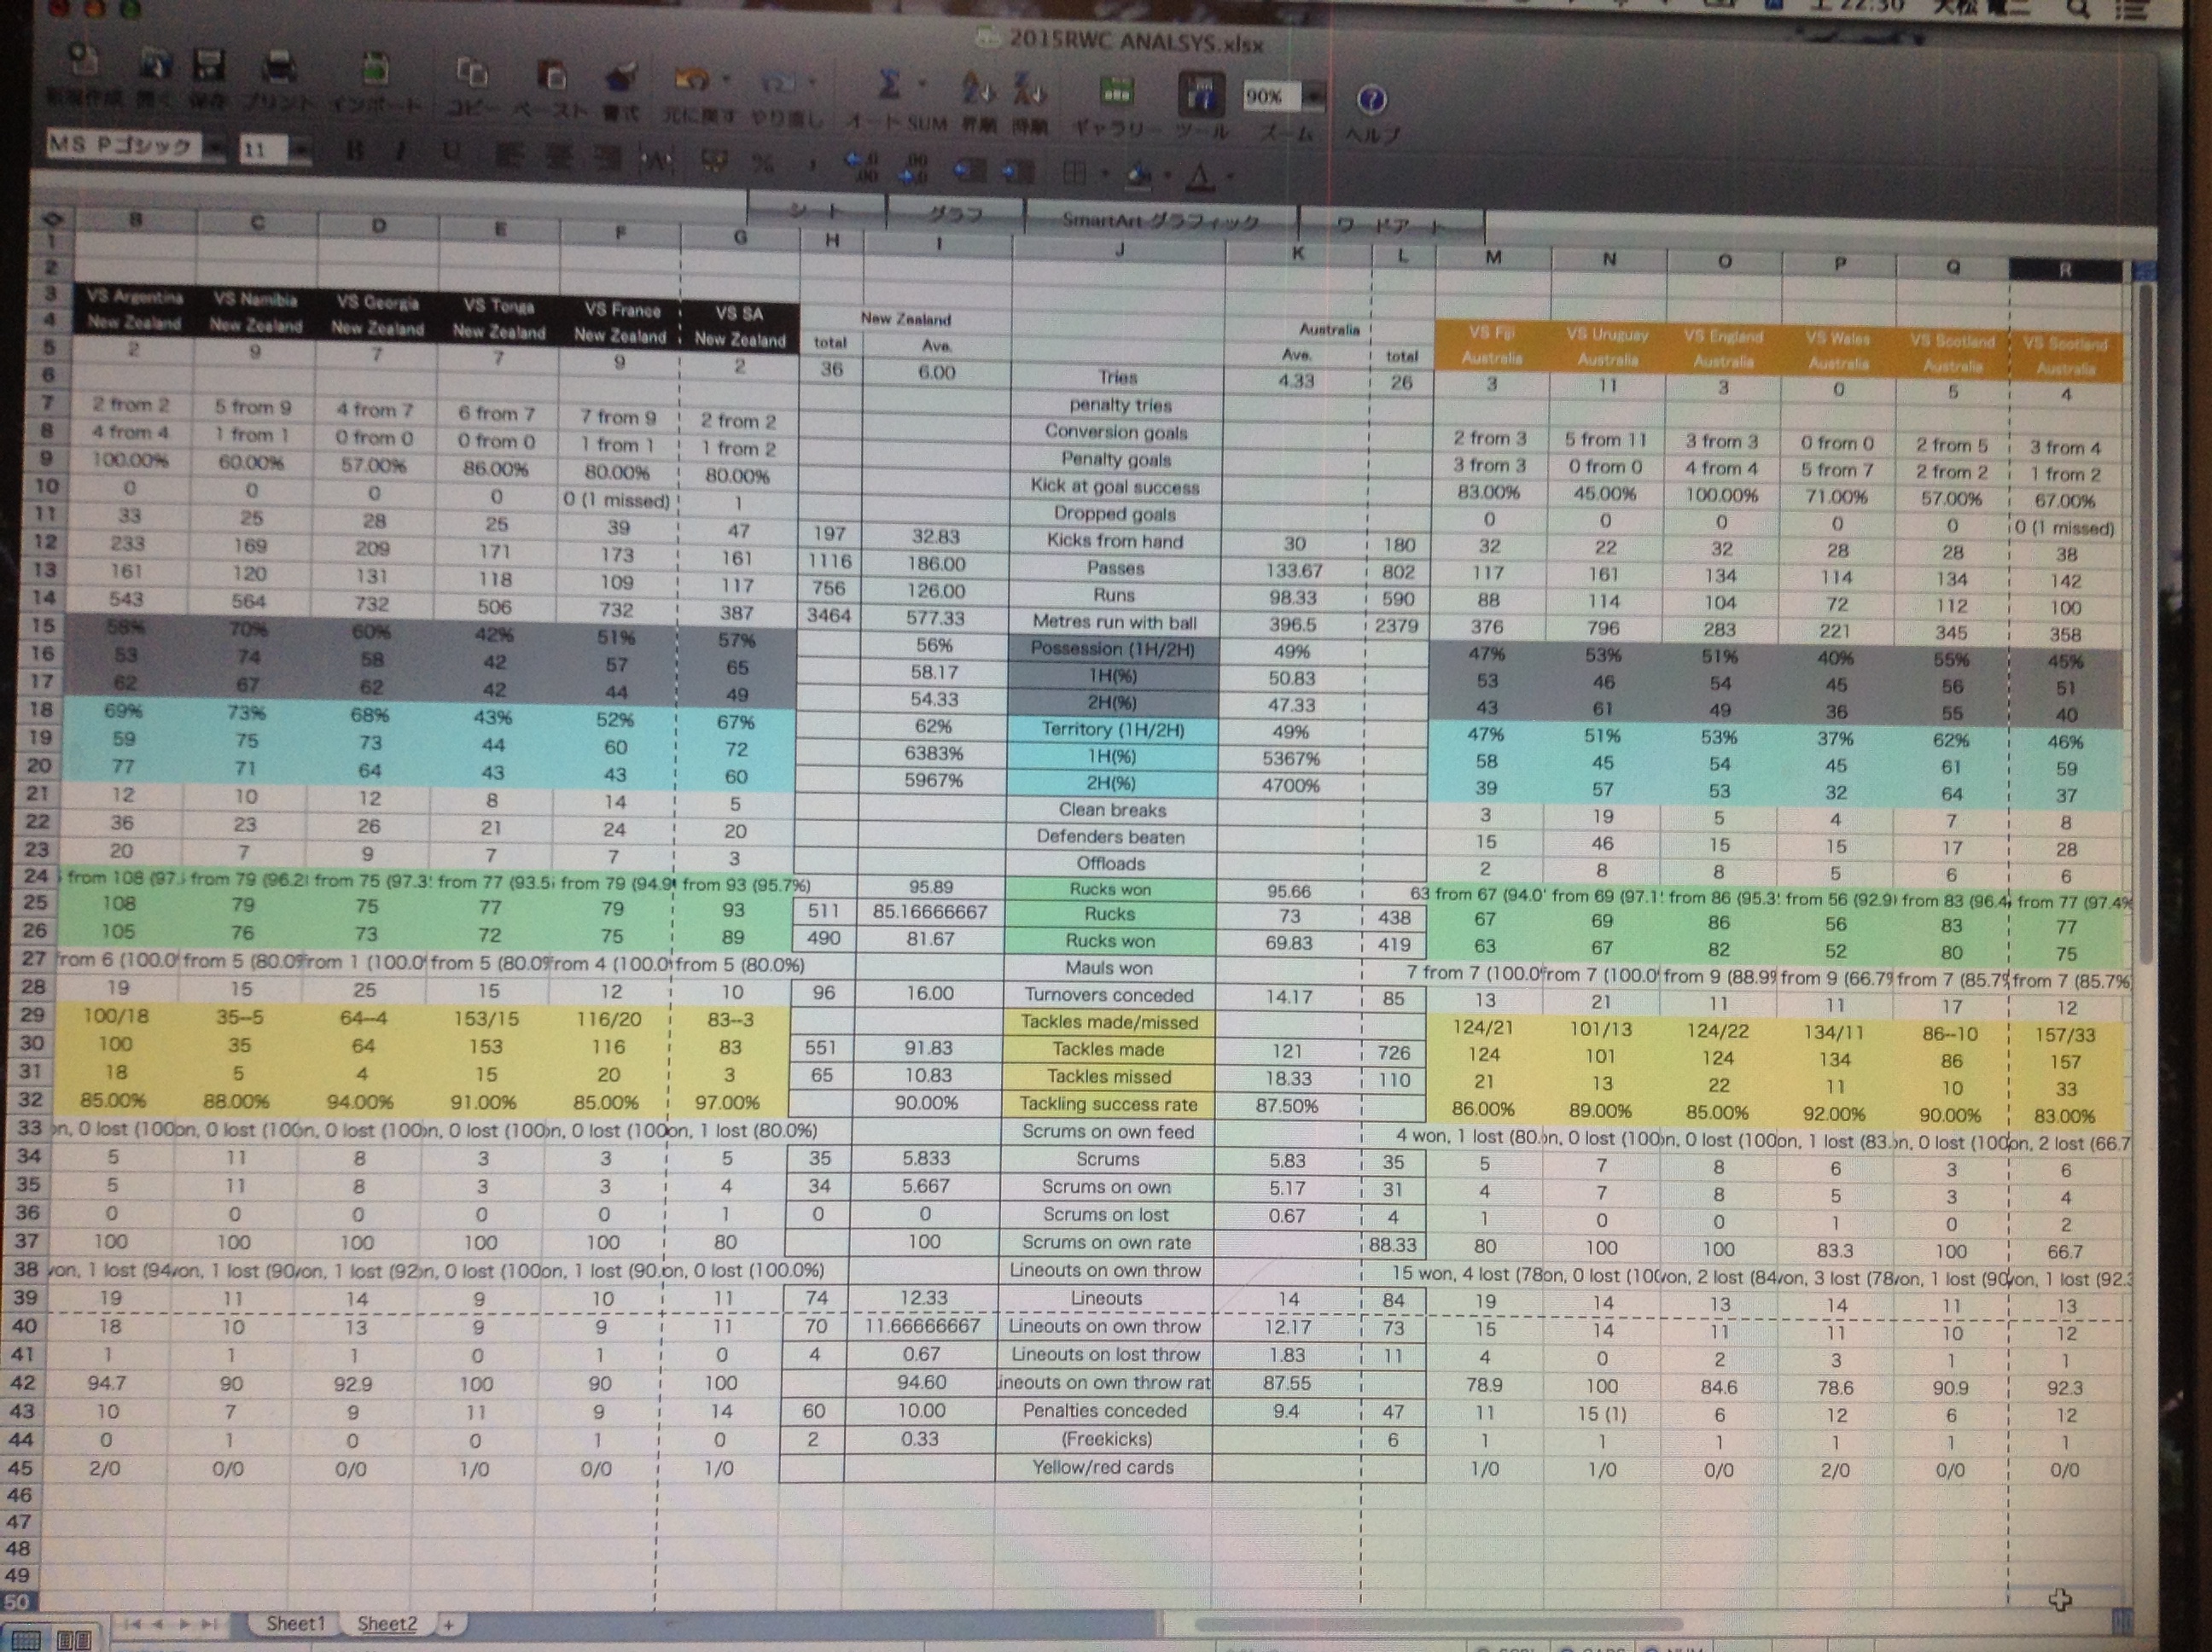
New Zealand Australia 両チームのスタッツ比較です。
参考までに。
| New Zealand | Australia | |||
| total | Ave. | Ave. | total | |
| 36 | 6.00 | Tries | 4.33 | 26 |
| penalty tries | ||||
| Conversion goals | ||||
| Penalty goals | ||||
| Kick at goal success | ||||
| Dropped goals | ||||
| 197 | 32.83 | Kicks from hand | 30 | 180 |
| 1116 | 186.00 | Passes | 133.67 | 802 |
| 756 | 126.00 | Runs | 98.33 | 590 |
| 3464 | 577.33 | Metres run with ball | 396.5 | 2379 |
| 56% | Possession (1H/2H) | 49% | ||
| 58.17 | 1H(%) | 50.83 | ||
| 54.33 | 2H(%) | 47.33 | ||
| 62% | Territory (1H/2H) | 49% | ||
| 64% | 1H(%) | 54% | ||
| 60% | 2H(%) | 47% | ||
| 61 | 10.16666667 | Clean breaks | 7.666666667 | 46 |
| 150 | 25 | Defenders beaten | 22.66666667 | 136 |
| 53 | 8.83 | Offloads | 35 | |
| 95.89 | Rucks won | 95.66 | ||
| 511 | 85.17 | Rucks | 73 | 438 |
| 490 | 81.67 | Rucks won | 69.83 | 419 |
| Mauls won | ||||
| 96 | 16.00 | Turnovers conceded | 14.17 | 85 |
| Tackles made/missed | ||||
| 551 | 91.83 | Tackles made | 121 | 726 |
| 65 | 10.83 | Tackles missed | 18.33 | 110 |
| 90.00% | Tackling success rate | 87.50% | ||
| Scrums on own feed | ||||
| 35 | 5.833 | Scrums | 5.83 | 35 |
| 34 | 5.667 | Scrums on own | 5.17 | 31 |
| 0 | 0 | Scrums on lost | 0.67 | 4 |
| 100 | Scrums on own rate | 88.33 | ||
| Lineouts on own throw | ||||
| 74 | 12.33 | Lineouts | 14 | 84 |
| 70 | 11.67 | Lineouts on own throw | 12.17 | 73 |
| 4 | 0.67 | Lineouts on lost throw | 1.83 | 11 |
| 94.60 | Lineouts on own throw rate | 87.55 | ||
| 60 | 10.00 | Penalties conceded | 9.4 | 47 |
| 2 | 0.33 | (Freekicks) | 6 | |
| Yellow/red cards | ||||